
User-specific customizable dashboard
When you log into the service, you will see your customizable dashboard first. You can edit the content of the dashboard and select the information that interests you and is most useful in your daily use.
The service also allows for managing customer-specific dashboard templates. These are useful when new users are added to the service. A ready-made dashboard template is always selected for a new user from among customer-specific templates, such as task-specific ones. The user can then customize their assigned dashboard template to suit their needs.
Widgets
The homepage consists of widgets that you can choose and arrange in the desired order. The size and number of widgets adjust automatically based on the browser or device window size. On mobile devices, the widgets are stacked vertically instead of side by side. Widgets can have different functions that allow you to control their displayed content. The specific functions of each widget are explained in more detail later on this page.
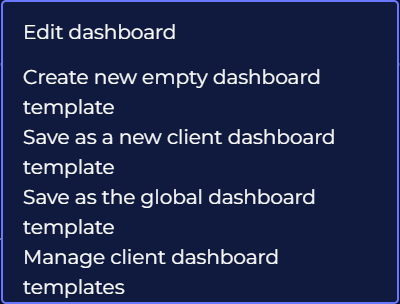
Edit Menu on the Dashboard
Click on the arrow button in the top right corner of the dashboard to open the dashboard editing menu.
|
Edit dashboard |
Switch to edit mode where you can add, remove, and arrange widgets. |
|
Create new empty dashboard template |
Create a new custom dashboard template from scratch |
|
Save as a new client dashboard template |
Save your current dashboard as a new template for the customer's dashboard. |
|
Save as the global dashboard template |
This function is only visible to administrators. |
|
Manage client dashboard templates |
Open the window where you can edit dashboard templates. It is only visible when at least one dashboard template exists. |
Edit mode
In edit mode, a editing toolbar will appear on the dashboard by clickin the arrow.
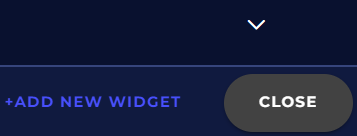
The Add new widget -button opens a menu where you can select the type of widget to add.
The Close button ends the editing mode and closes the editing toolbar.
In editing mode, there is a trash can button at the top right corner of each widget that removes the widget.
In editing mode, you can change the order of widgets by dragging and dropping them.
Note that in edit mode on the dashboard, you cannot edit individual widget settings. To do this, first close the edit mode.
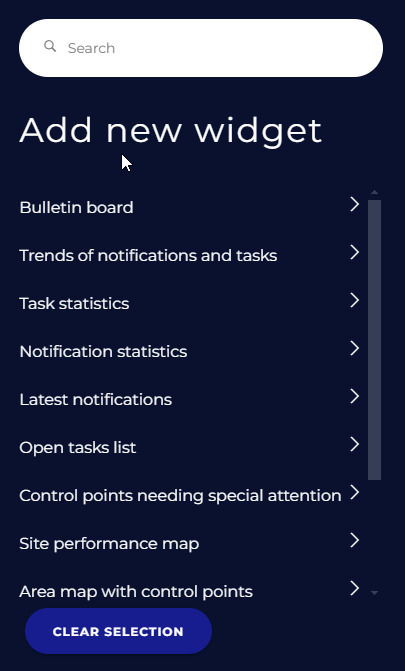
Add new widget
The Add new widget button opens a dropdown menu where you can select the type of widget to add. The available widgets may vary. See the descriptions and functions of different widget types below on this page.
Create a new empty client dashboard template
Write a descriptive name for the new dashboard template and click Create a new empty dashboard template -button.
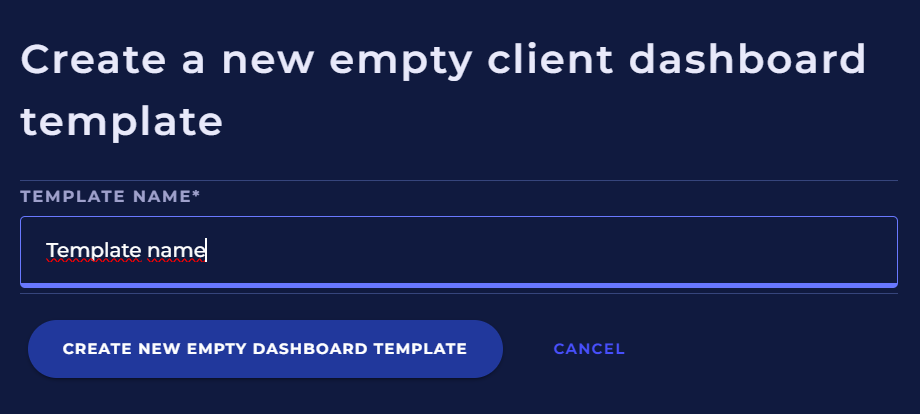
Next, you can start adding and organizing widgets on the new dashboard template, just like in edit mode for the dashboard.
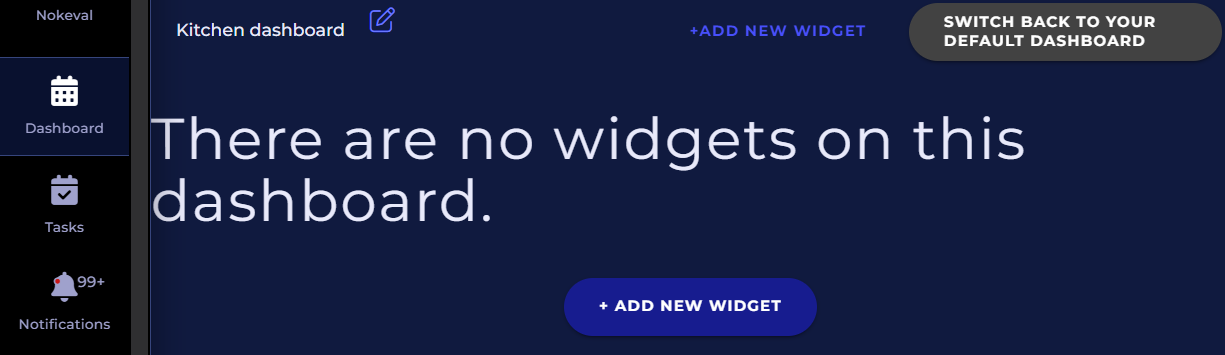
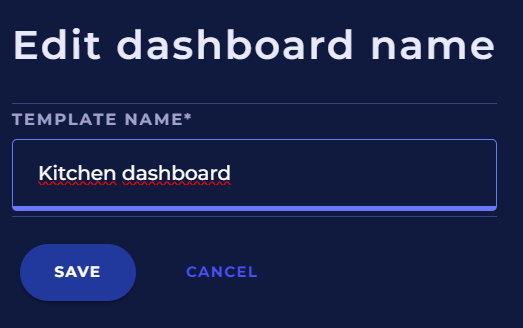
You can also edit the name of the dashboard template from the pencil icon in the top left corner.
From the button in the top right corner, Switch back to your default dashboard, you can close the dashboard template editing and go back to your default dashboard. The changes you made will be saved to the new dashboard template.
Save as a new client dashboard template
With this function, you can save your own dashboard as a new customer-specific dashboard template.
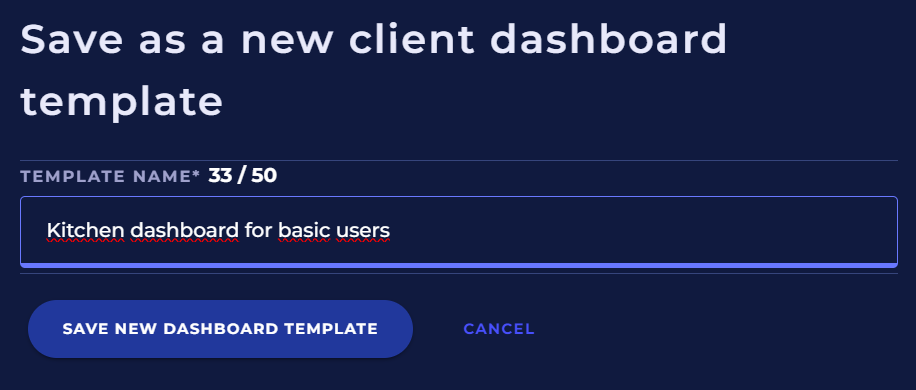
Enter a descriptive name for the template and click on Save new dashboard template. The editing process is the same as when creating a new blank dashboard template.
Save as the global dashboard template
This function is only available to administrators and allows them to edit and save the global dashboard template, which will be set as the default dashboard template for new customers created in the service.
Manage client dashboard templates
With the dashboard template management feature, you can create new empty dashboard templates, open existing templates for editing, delete existing dashboard templates, and share them for viewing via a public link even with users who do not have an account on the service.
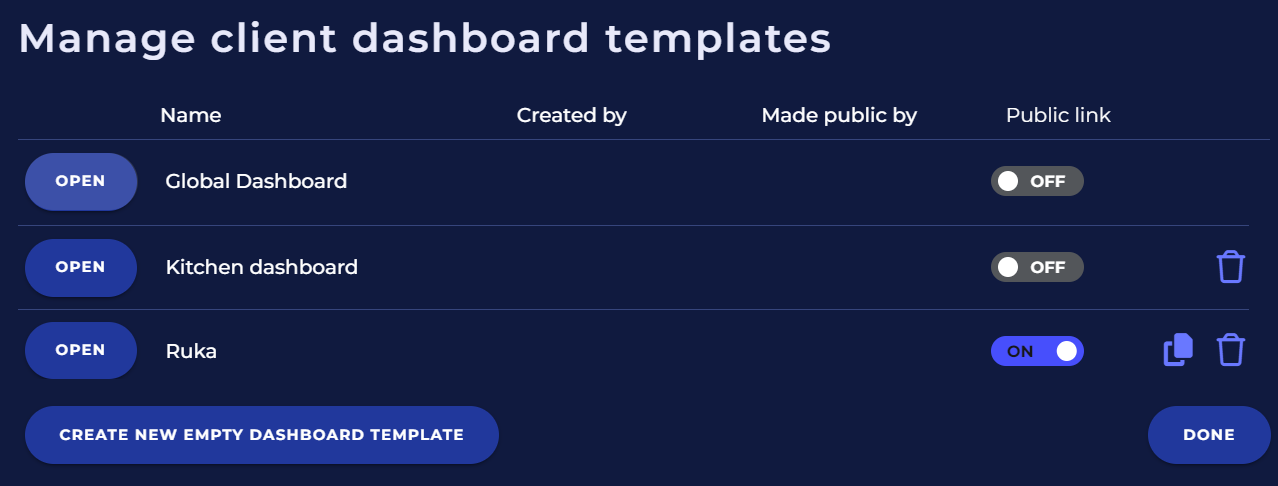
Open
Click the Open button on the template to open it for editing. You can then also edit the name of the dashboard template.
Public link
Select the power switch in the Public Link column to choose whether you want to share the selected dashboard template through a public link. The list displays the name of the user who has shared the dashboard template. Once the dashboard template is shared, click on the copy icon to copy the public link (URL) to your clipboard. Paste the public link into your browser's address bar to view the content of the public dashboard template.
To remove the dashboard
Click on the trash can icon on the dashboard template to delete it.
Widget types
Bulletin Board
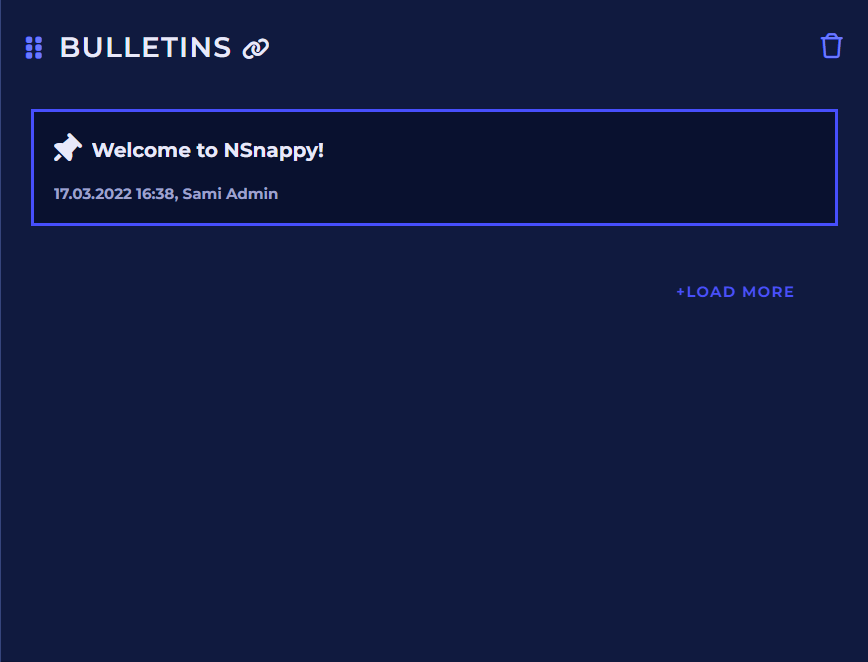
The Bulletin board widget displays current bulletins in a bulletin board format. The pinned bulletin is always at the top, if one exists.
Functions
If there are more bulletins than can fit in the widget, click the Load more button.
By clicking on the widget title, you can directly access the bulletin management.
Trends of notifications and tasks
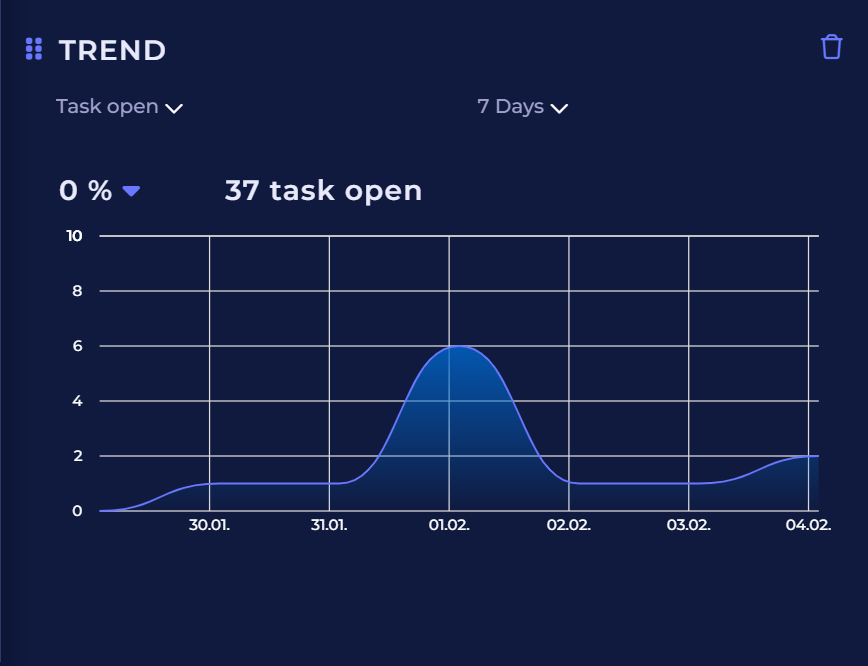
You can use the Trends of notifications and tasks widget to see how the number of tasks and notifications has evolved recently.
Functions
You can choose which trend the widget displays for tasks or notifications:
-
Task executed: Completed tasks
-
Task Expired: Expired tasks
-
Task open: Tasks awaiting completion
-
Allerts triggered: Total number of alarm notifications
-
Warnings triggered: Total number of warning notifications
-
Informatives triggered: Total number of informational notifications
-
Notifications triggered: Total number of all notifications
-
Notifications acknowledged : Number of acknowledged notifications
You can select the time period for which the trend is displayed:
-
1 day
-
7 days
-
30 days
-
90 days
Task statistics
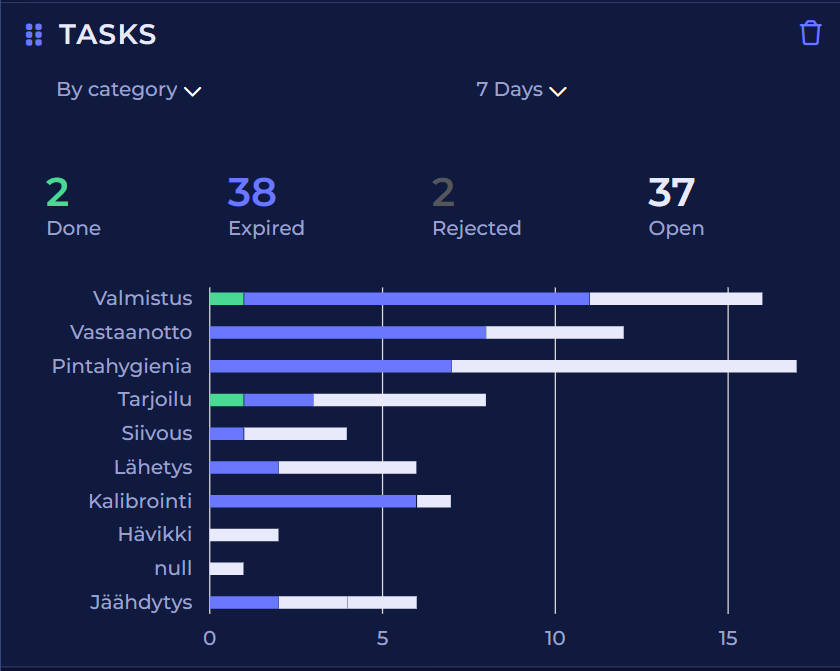
The Task statistics widget displays statistical information about the number of tasks recently.
Functions
You can choose how tasks are displayed:
-
By category
-
By control poinnt
-
By site
You can choose the time period for displaying task counts:
-
1 day
-
7 days
-
30 days
-
90 days
Notification statistics
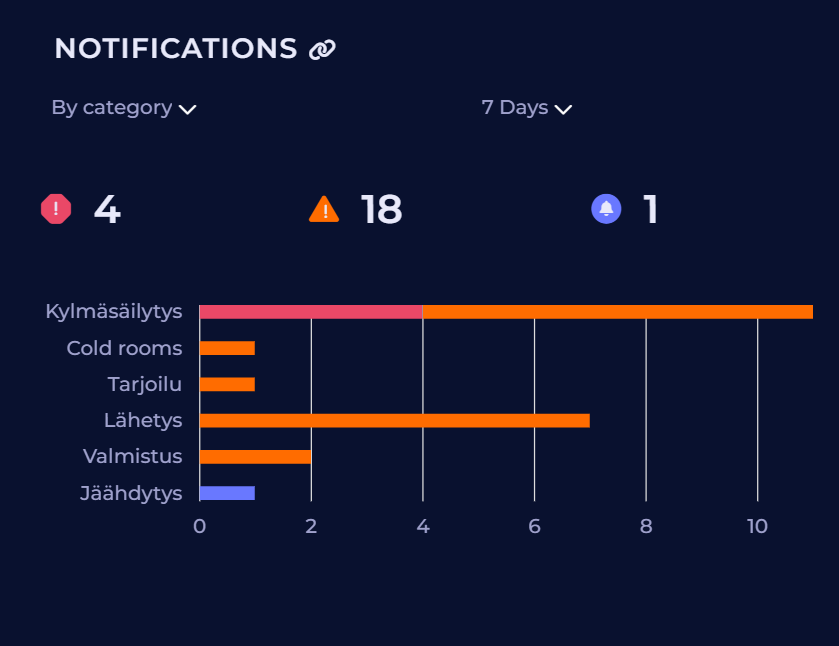
The Notification statistics widget displays statistical information about the quantities of notifications recently.
Functions
By clicking on the widget title, you can directly access the notifications page.
You can choose to display notifications by:
-
Categories
-
Sites
You can select the time period for displaying task assignments:
-
1 day
-
7 days
-
30 days
-
90 days
Latest notifications
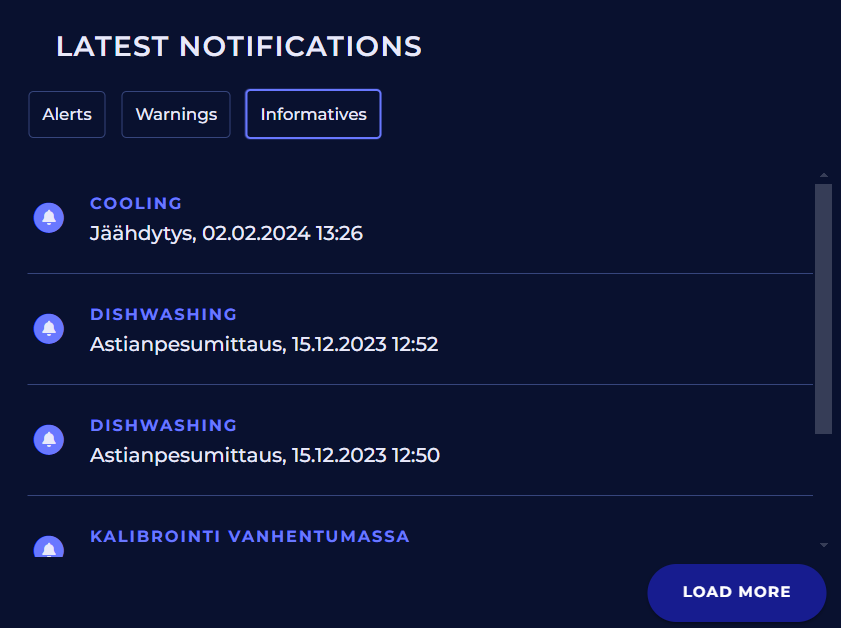
The Last notifications widget displays a list of the latest notifications.
Functions
If there are more notifications than initially loaded on the widget, click the Load More button. On the right side, there is a scroll bar to navigate through the list.
The widget has three buttons to choose what is displayed on the list:
-
Alerts
-
Warnings
-
Informatives
By clicking on a notification in the list, you can acknowledge it. If the notification has already been acknowledged, you can view its details and edit additional information.
Open tasks list
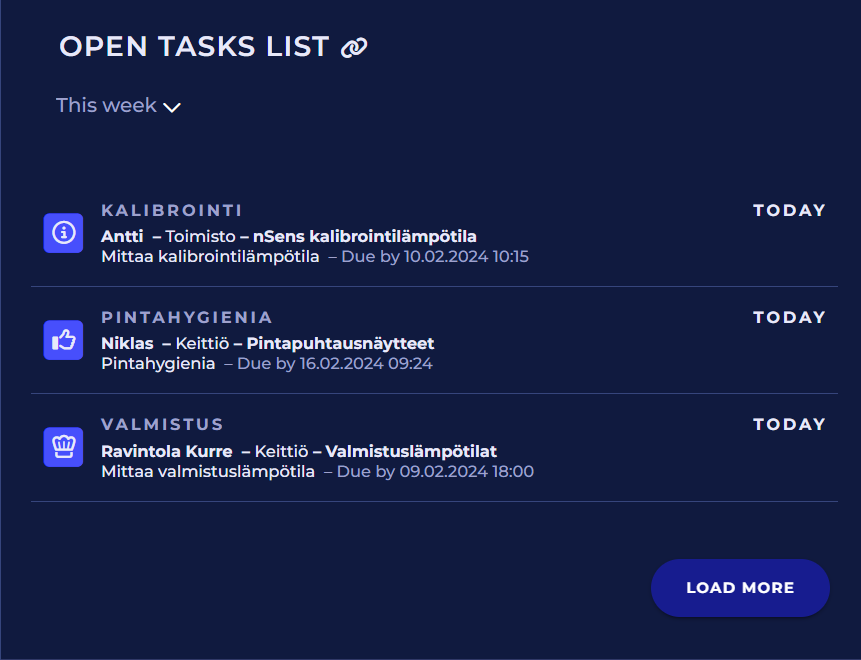
The Open tasks list widget displays open tasks awaiting completion within the selected time frame.
Functions
If there are more tasks than initially loaded, click the Load More button. On the right side, there is a scroll bar to navigate the list.
You can choose to display open tasks for:
-
Today: For the current day
-
This week: For the current week
-
This month: Within the current month
Clicking on a task in the list will allow you to complete it.
Control points needing special attention
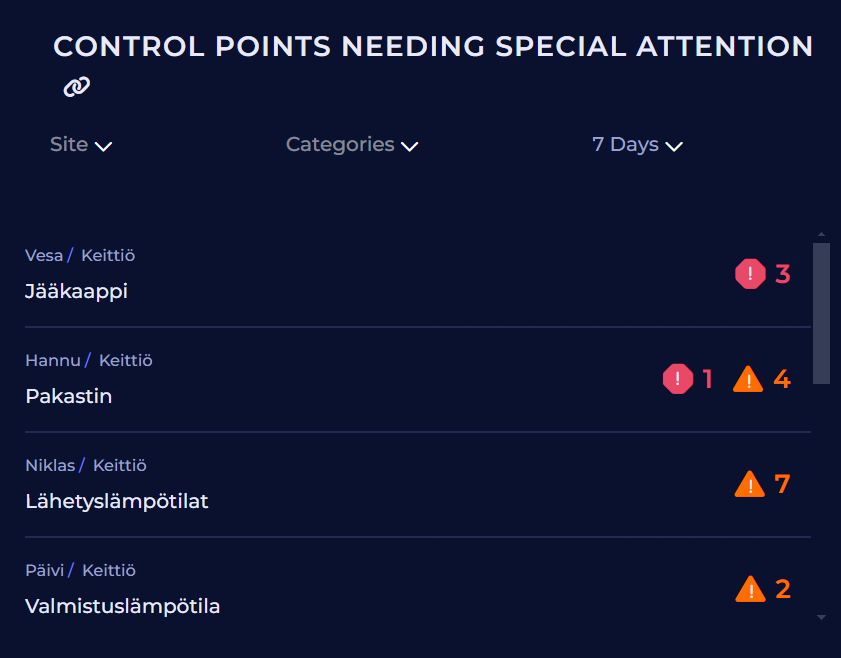
The Control points needing special attention widget displays a list of control points with the highest number of notifications. The list is sorted by the number of alerts, with the points having the most alarms at the top, followed by warnings as a secondary sorting condition, and information as third.
Functions
You can choose which control points of the office are displayed with this widget.
You can select which category of control points is displayed.
You can choose the time period for which the number of notifications is retrieved:
-
1 day
-
7 days
-
30 days
-
90 days
Site performance map
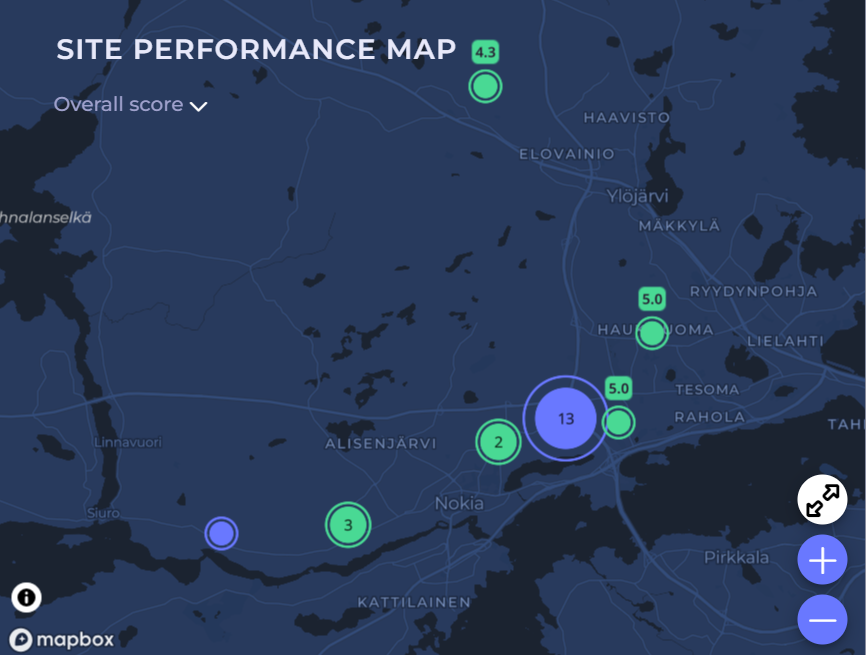
The Site performance map widget displays a map with the locations of the sites, along with their ratings shown as numerical values.
Functions
When you hover over the circle marking a site's location, you can see the name of the site.
You can choose to display on the map for each site:
-
Overall score
-
Critical control points score
-
Alert acknowledgment score
-
Task excecution score
Area map with control points
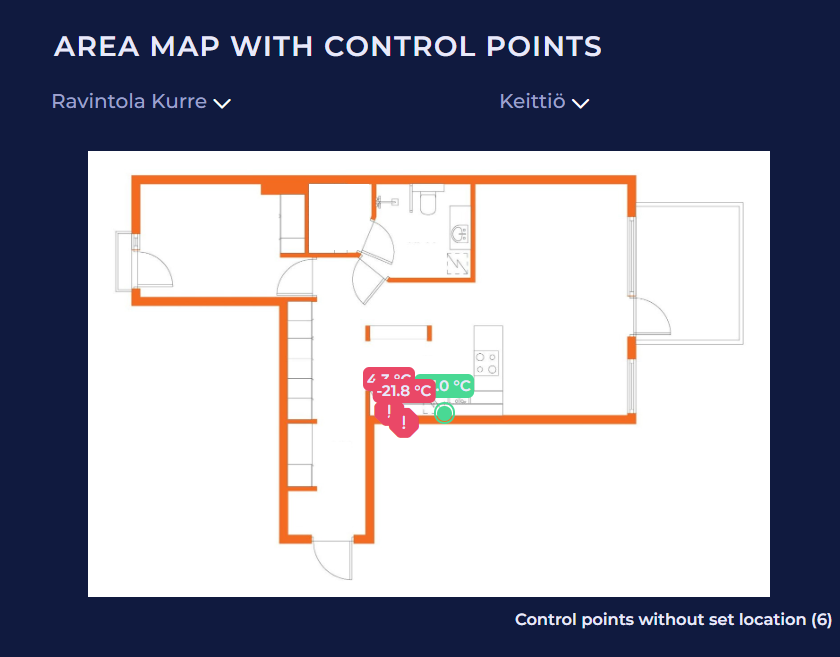
The Area map with control points widget displays the floor plan of a selected site and the locations of control points on top of the floor plan.
Functions
You can select a site and its area to display the floor plan and cntrol points with the widget.
When you move your cursor over the circle indicating the location of a control point, you will see the latest measurement values for that control point. The colors represent the severity of any notifications at those control points.
Site performance score
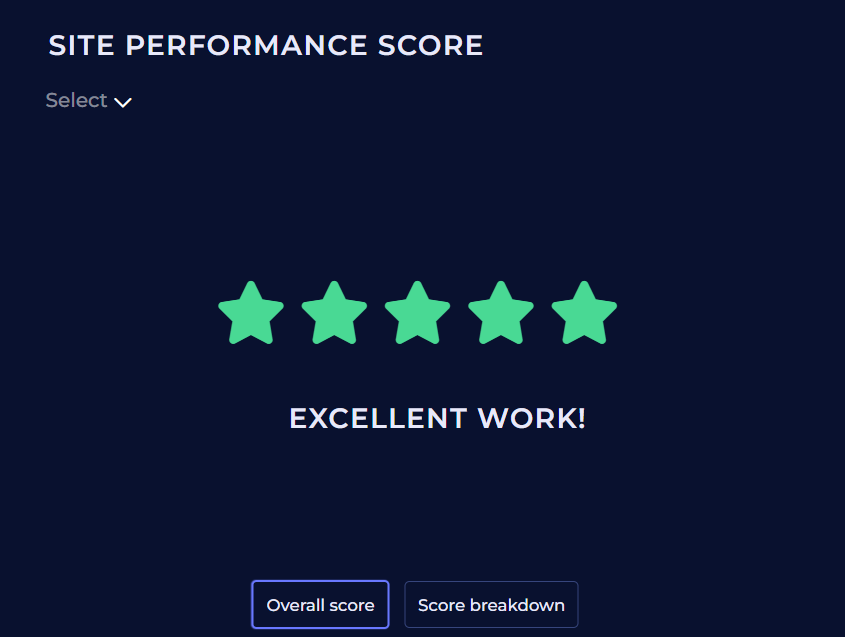
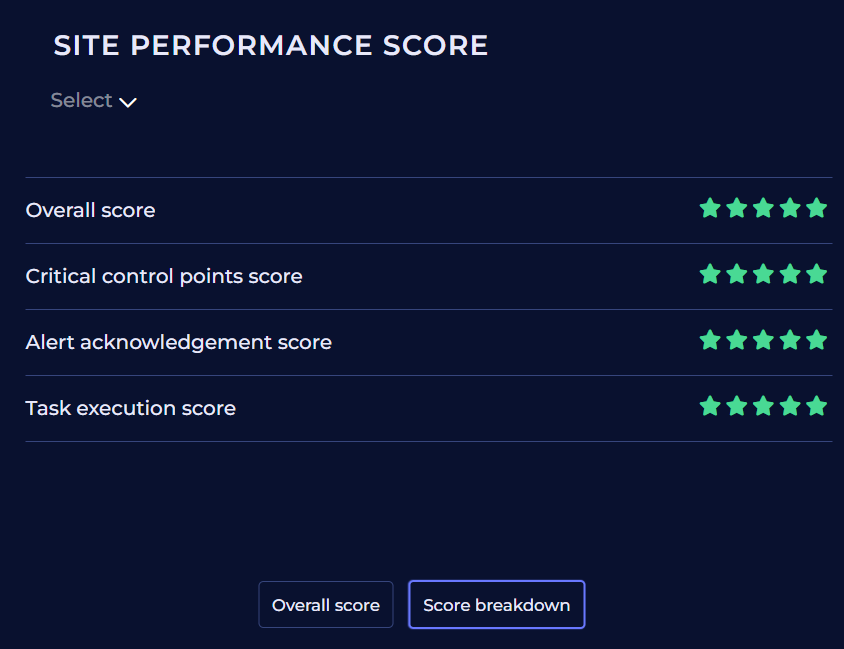
The Site performance score widget displays the overall score or scores for a selected site.
Functions
You can select the site whose score the widget will display.
You can choose whether the widget displays scores divided to parts and overall score or only the overall score.
Executed tasks
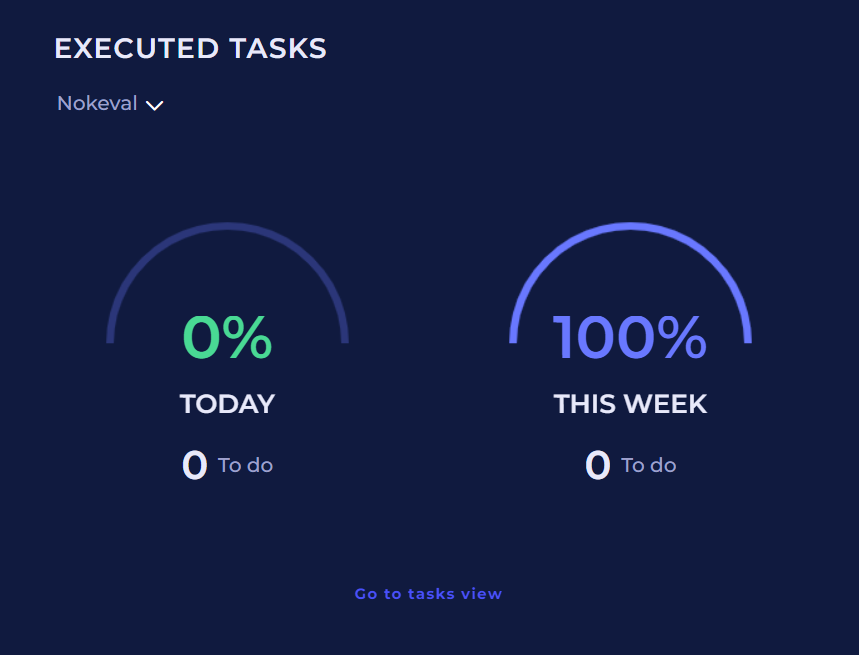
The Executed tasks widget displays the percentage of completed tasks for the selected site today and this week. The widget also shows the number of incomplete tasks for the same time periods.
Functions
You can select a site to display its task counts in the widget.
You can click on the Go to task view link to navigate to complete tasks through the task view.
Channel value and trend view
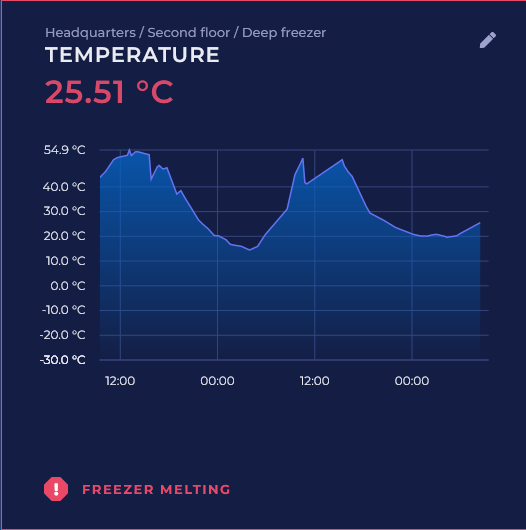
The Channel value and trend view widget displays the latest measurement result or graph for the selected channel over the last few hours or days, depending on your choice. Additionally, you can choose to display the notification status and tasks in the widget. The background color of the widget reflects the color of the most severe active notification for that channel.
Functions
Click on the pen icon in the top right corner of the widget to edit its settings, such as selecting which channels information it displays.
Selected Channel
The name of the selected channel is shown here. You can use the Select channel button to choose a different one.
Presentation type
Most recent result (numeric): The widget displays the latest measurement value of the channel with large numbers if it is less than a day old.
Trendline: The widget displays the most recent measurement values of the channel as a graph for the selected time period.
Displayed additional information
Notifications: Shows details of the latest and most severe notification for the channel.
Tasks: Displays details of the latest task and total number of tasks for the channel.
Trendline time range
Select a time period for which you want to display the graph: 4 hours, 8 hours, 12 hours, 24 hours, or 48 hours.